Gaining Ground: The Impact of StrongMind
StrongMind uses the best of emerging technologies and learning science to drive improved academic outcomes.
To this end, we invite you to explore how StrongMind’s digital curriculum has helped one school improve student growth by 9-12% on state assessments for English language arts (ELA) and math.
The School
This case study focused on an AdvancEd-accredited, NCAA-approved Arizona public school that offers courses 100% online to more than 26,000 students throughout the state each year.
Because of the substantial challenges faced by the majority of its students, the online charter school wanted to provide the most engaging and effective digital curriculum possible. Seventy percent or more of the full-time students enrolled in the school fall into one or more of the following categories:
- Have a documented history of disruptive behavioral issues
- Are returning to school after having dropped out
- Are at least one year behind on academic credits or grade-level performance
- Are primary caregivers or financially responsible for dependents
- Are adjudicated
- Are wards of the state
In 2015, the online high school became the first to fully adopt and implement StrongMind’s digital curriculum. This provided the opportunity to compare an external measure—typical student growth scores on statewide standardized assessment—before and after the adoption of StrongMind courses.
What We Found
Despite the challenging population, the school was able to demonstrate statistically higher median growth scores in ELA, math, and both subjects combined after implementing StrongMind curriculum.
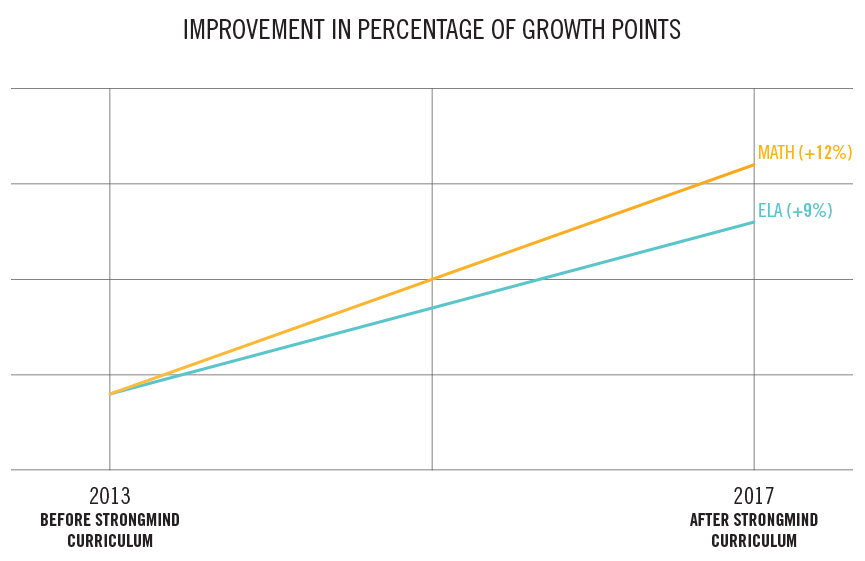
After implementing StrongMind curriculum, the school gained 9 percentage points in ELA and 12 percentage points in math.

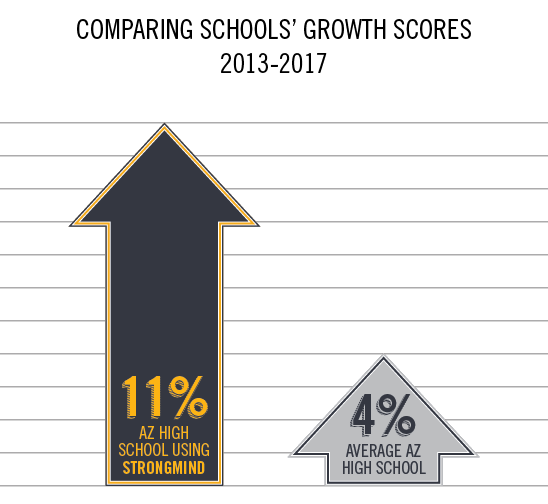
Overall student growth percentiles (SGP) scores increased by an average of one percentage point for high schools statewide within a single year (four percentage points over four years), while the school that adopted StrongMind curriculum experienced almost three times the growth in the same time period.
The school gained 9 percentage points in ELA, 12 percentage points in math, and 11 percentage points in overall growth. These findings are particularly striking in light of data from the Arizona Department of Education (2014) indicating that within a single year, the median growth for traditional high schools throughout the state increased by an average of one percentage point.
The Study
Student Growth Percentiles (SGP)
After most states adopted college- and career-ready standards, many began calculating (SGP to rank students’ academic gain on various statewide standardized tests. According to the American Institutes for Research, a dozen states calculate SGP (English, 2017) scores to include in each of their school accountability systems.
SGP measures how a student’s performance from one year to the next compares to the performance of the student’s academic peers who scored similarly in the past on the same test(s) (Betebenner, 2009). The focus of growth percentiles is not how high or low the student’s current score is but rather how much more or less growth a student made from one year to the next compared to students who scored similarly in the past.
The use of SGP adds context for measuring academic performance since students may not change achievement levels from year to year but could have a high growth percentile. SGP helps define how much relative growth a student has made because even students with low test scores can demonstrate high levels of learning over time (Castellano & Ho, 2013). For example, one student may be performing at a level well below proficiency yet experience high rates of growth compared to other students who also struggle academically. On the other hand, a student in the highest performance level could remain high-performing but grow substantially less than similar high-performing students.
Significant improvement in a school’s student growth scores signifies that an educational approach has positively impacted student learning.
While a student growth ranking demonstrates relative growth for an individual student, the median score of all students in the school is needed to examine growth at the school level. The median score is obtained by ordering individual student percentile rankings from lowest to highest and then identifying the middle score. Median scores are a valuable tool because they are not influenced by unusually high or low scores, they provide a single number to represent the group, and they can be used to compare multiple student groups.

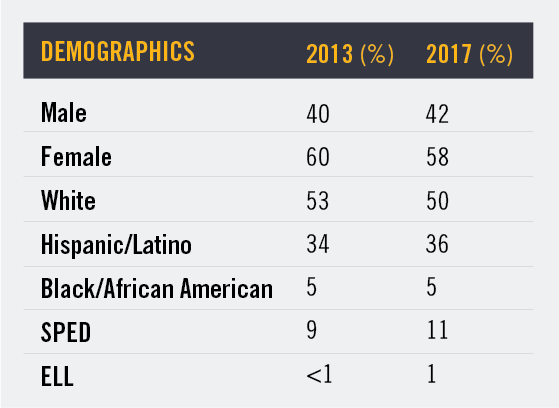
We compared demographic data of students enrolled at the school in 2013 as well as in 2017 to ensure the groups were statistically similar enough to draw comparisons.
Methodology
We used Mann-Whitney’s U test to compare two sets of data;1 2017 growth rankings for students who had completed StrongMind curriculum and 2013 growth rankings for students at that same school prior to its adoption of StrongMind courses. Student-level growth percentile data from the 2013-2014, 2014-2015, and 2015-2016 school years were not available for analysis.
Aggregated median scores were identified for ELA, math, and overall combined growth. Inferential statistics were then conducted to compare 2013 median growth to 2017 median growth. Median ELA growth (Mdn = 42) was 9 percentage points higher in 2017 (N = 320) than median ELA growth (Mdn = 33) in 2013 (N = 454), U = 156556.00, p = .01. Median math growth (Mdn = 31) was 12 percentage points higher in 2017 (N = 105) than median math growth (Mdn = 19) in 2013 (N = 445), U = 73664.50, p < .01. Median overall growth (Mdn = 37) was 11 percentage points higher in 2017 (N = 430) than median overall growth (Mdn = 26) in 2013 (N = 903), U = 442504.50, p < .01.
Results: The high school demonstrated statistically higher ELA, math, and overall median growth rates in 2017 than in 2013.
Conclusion
Our goal in conducting this analysis was to understand the impact of StrongMind’s curriculum on a school’s ability to demonstrate academic growth. Utilizing the two years of data available, 2013 and 2017, we compared the median growth at an online high school before and after the adoption of StrongMind curriculum. Findings indicate that the school’s academic growth significantly improved after implementing StrongMind’s curriculum. Median or typical student growth within the school was significantly higher for ELA and math after the school fully implemented StrongMind curriculum.
Despite challenges faced by the student population, the growth demonstrated by this online high school far exceeds the typical growth of all high schools in the state during the same time period.
The school’s improved SGP scores suggest StrongMind’s curriculum is having a positive impact on student academic growth.
About Us
Research
StrongMind engages in meaningful research to better understand factors associated with student engagement and academic success. The StrongMind team leading these research efforts includes researchers with doctoral degrees in education measurement, data scientists who have published in the field of machine learning, and established thought leaders in user-experience research. Findings from our investigations empower us to make impactful, data-driven decisions to guide the development of products and interactive tools that deliver effective educational experiences and improved academic outcomes.
StrongMind Curriculum
StrongMind’s digital curriculum goes beyond state and national standards to engage students with relevant content and exciting multimedia elements. This curriculum has earned more than 60 awards, including two Education Technology CODiE Awards, two EdTech Digest Awards, and numerous regional Emmys and Telly Awards. Our courseware incorporates high-quality assessments developed by Key Data Systems and Assessment Technology Inc. as well as advanced reporting and analytics that allow educators to provide a more personalized education and to help students precisely when and where they need it most.
Explore How You Can Engage Your Students for Improved Academic Outcomes
References
Arizona Department of Education. (2014). 2014 A-F Letter Grades [PowerPoint]. Retrieved from https://cms.azed.gov/home/GetDocumentFile?id=5914e3723217e10ce849325f
Betebenner, D.W. (2009). Norm-and criterion-referenced student growth. Educational Measurement: Issues and Practice, 28(4), 42-51.
Castellano, K.E., & Ho, A.D. (2013). A Practitioner’s Guide to Growth Models. Report commissioned by the Council of Chief State School Officers.
English, D. (2017). Proposed State Accountability Systems Under the Every Student Succeeds Act: A summary of Fall 2017 Submissions. Retrieved from https://www.air.org/sites/default/files/Summary%20of%20State%20Accountability%20Snapshots_FINAL-2-Nov-2017.pdf
Footnotes
1 Student growth data for the online high school was obtained from the Arizona Department of Education for school years 2012-2013 and 2016-2017. Student-level SGP data for the 2013-2014 school year were not available for analysis; the Arizona Department of Education did not calculate SGP data for any schools in school years 2014-2015 and 2015-2016.


